
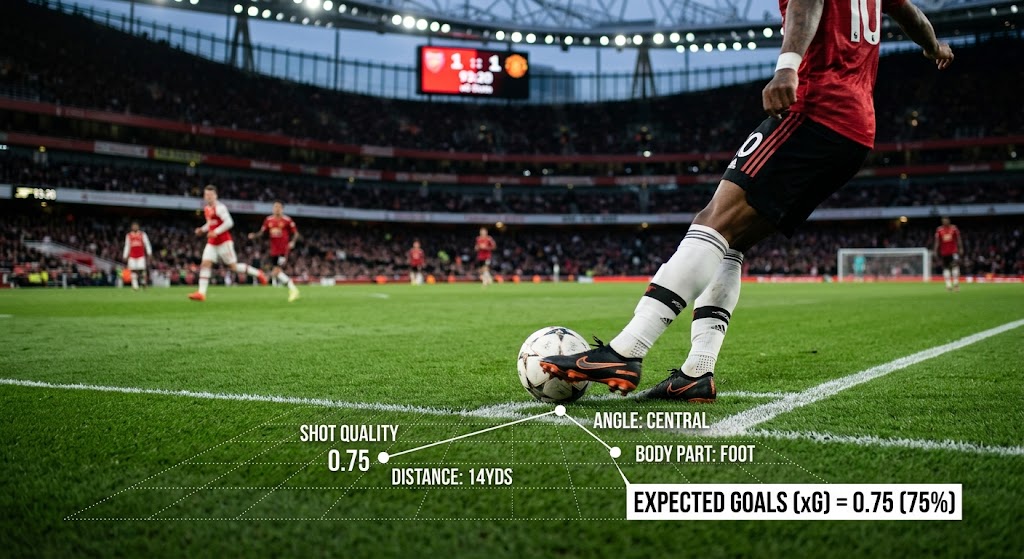
In soccer stats, xG stands for Expected Goals. It is a statistical metric that measures the quality of a scoring chance on a scale from 0.00 to 1.00. An xG rating of 0.10 means an average player scores that exact shot 10% of the time, while a penalty kick carries a fixed value of 0.79.
What Does xG Mean in Soccer?
If you have watched modern football broadcasts on Sky Sports, NBC, or TNT, you have likely seen “xG” displayed alongside traditional match stats like possession and total shots.
For decades, fans and commentators evaluated a team’s dominance using total shots and shots on target. However, traditional shot counts are fundamentally flawed. A wild 35-yard speculative effort that trickles into the goalkeeper’s arms counts as one shot on target—the exact same value assigned to an unattached tap-in from two yards out.
That is where Expected Goals comes in.
In simple terms, xG measures shot quality rather than shot quantity. Instead of treating every attempt equally, xG assigns a probability score to every single shot taken during a match based on thousands of historical shots taken from similar situations.
| xG Value | Scoring Chance | Description & Example |
| 0.01 xG | 1% | Nearly impossible scoring opportunity (e.g., a shot from the halfway line). |
| 0.50 xG | 50% | Massive scoring chance (1 out of 2 attempts). |
| 0.79 xG | 79% | Penalty kick (statistically scored 79% of the time in professional football). |
| 1.00 xG | 100% | Guaranteed goal (does not officially exist in models due to potential human error). |
When you see a team finish a match with 2.40 xG, it means that based on the quality of chances created, an average team would be expected to score between two and three goals from those opportunities.
How is xG Calculated?
Statistical models developed by data providers like Opta Analyst and StatsBomb calculate xG by comparing a real-time shot against historical databases containing hundreds of thousands of recorded shots.
When a player strikes the ball, computer algorithms instantly evaluate several key variables as shown in the table below.
| Key Factor | Description & Impact on xG |
| Distance to Goal | How far the shooter is from the goal line. |
| Shot Angle | Whether the player is directly central or shooting from an acute side angle. |
| Body Part Used | Headers carry lower xG probability than shots taken with a player’s dominant foot. |
| Type of Assist or Pass | Through-balls and ground crosses generate higher xG than high aerial crosses or scrambling rebounds. |
| Pattern of Play | Open-play chances carry different expectations than direct free kicks, corner kicks, or counter-attacks. |
| Defensive Pressure | Advanced models factor in the position of surrounding defenders and how close the goalkeeper is to the shooter. |
A Real-World Example
Imagine two scenarios in a Premier League match.
Scenario A involves Erling Haaland receiving a low cross across the six-yard box with the goalkeeper out of position. He only has to touch the ball into an empty net. Estimated xG = 0.85 (85% scoring chance).
On the other hand, in Scenario B, Bruno Fernandes takes a first-time volley from 30 yards out with four defenders blocking his sightline. Estimated xG = 0.03 (3% scoring chance).
Even if Fernandes scores a screamer while Haaland misqueues his tap-in, the xG value remains unchanged because it evaluates the quality of the chance at the moment the ball was struck, not the final result.
Why Tactical Analysts Use xG Over Basic Shot Counts
In my years analysing match data, the single biggest advantage of xG is its ability to separate process from outcome.
Football is inherently a low-scoring sport influenced by luck, deflections, and individual refereeing decisions. A team can play terribly, get outplayed for 90 minutes, and still win 1-0 thanks to a deflected long-range shot.
Looking strictly at the scoreline or basic shot totals tells an incomplete story. xG helps analysts evaluate underlying performance in three specific ways:
1. Identifying Unsustainable Form
If a team wins five matches in a row despite generating only 0.50 xG per game while allowing 2.50 xG to opponents, they are “overperforming their xG.” This usually indicates unsustainable luck or temporary god-mode goalkeeping. Over a 38-game season, their results will almost always regress to the mean.
2. Evaluating Striker Efficiency
By comparing a player’s actual goals scored against their total accumulated xG, scouts can determine whether a forward is an elite finisher or simply benefiting from great service. When reviewing top-tier strikers in our Haaland vs. Osimhen career stats comparison, xG reveals how consistently world-class forwards convert low-probability chances into goals.
3. Measuring Defensive Solidity
A team that allows 20 shots per game might look leaky on paper. However, if those 20 shots are all weak 30-yard efforts carrying an average xG of 0.02, the defence is actually doing a fantastic job of forcing opponents into low-value areas.
Important Variations [Non-Penalty xG (npxG)]
Because penalty kicks carry a massive fixed value of 0.79 xG, a team or player awarded frequent penalties can artificially inflate their statistical output.
To fix this bias, analysts frequently use npxG (Non-Penalty Expected Goals).
Removing penalties from the dataset provides a much clearer picture of how well a team creates opportunities in open play and set-piece scenarios. If Forward A has 15 goals from 12.0 npxG, while Forward B has 15 goals but 6 of them were penalties (accumulating 4.74 xG from spot-kicks alone), Forward A is generating significantly more threat in open play.
Where to Find Free xG Stats
You do not need access to expensive pro-scouting software to track xG figures for your favourite clubs and players. Several excellent public databases offer free match-by-match and seasonal xG data:
- FBref is powered by Opta data, and it provides complete xG, npxG, and xAG (Expected Assisted Goals) breakdowns across top men’s and women’s leagues worldwide.
- Understat is an excellent visual interface featuring interactive shot maps for Europe’s top five leagues.
- WhoScored is also great for combining xG data with match heatmaps and player ratings.
For a full breakdown of analytical tools, check out our curated guide to the best free soccer statistics websites.
Frequently Asked Questions About xG
No. Because xG represents a mathematical probability between 0% (0.00) and 100% (1.00), an individual shot can never exceed 1.00 xG.
Yes. Match xG is cumulative. If a team takes five shots during a game with xG values of 0.40, 0.30, 0.50, 0.20, and 0.10, their total team xG for the match would be 1.50.
Standard xG models evaluate the opportunity rather than the specific individual taking the shot. The model assumes an average professional player is taking the chance. This is intentional: it allows analysts to see which elite finishers (like Lionel Messi or Harry Kane) consistently score more goals than the average player would from the same positions.